
A Google PageSpeed Insights (PSI) report can show that a page has a slow server response, poor Largest Contentful Paint (LCP) or excessive main-thread work. However, it cannot tell you which WordPress component is responsible or whether a suggested change is safe for the website. At Ematic Solutions, we treat the PSI report as the starting point to optimize WordPress, rather than the solution itself. Our approach connects the weakest performance metrics to their likely technical causes, identifies the responsible layer, implements controlled improvements and verifies that performance gains are achieved without compromising the website’s design or functionality.
This section summarizes the key points covered in this article.
- A PSI report identifies what is slowing the page, but further investigation is needed to determine whether the cause comes from the WordPress theme, plugins, page builder, media, hosting, database, cache, CDN or third-party services.
- Optimization priorities should be based on the affected metric and its likely impact. Issues affecting LCP, INP/TBT and CLS generally deserve more attention than minor opportunities with limited user-facing impact.
- WordPress performance should be optimized at the appropriate layer. Front-end assets, images, plugins, database queries, server response time, caching and CDN delivery require different solutions and should not be treated as the same problem.
- Make one controlled change at a time, clear the relevant cache layers and retest under comparable conditions. Changing several settings simultaneously makes it difficult to determine which adjustment actually improved or degraded performance.
- A PageSpeed Performance score of 90+ is considered Good, but 100 should not be treated as a mandatory target.
- Production should be monitored after deployment because its cache, CDN, security and third-party configuration may differ from staging. Lab improvements can appear immediately, while field-data improvements take longer to become visible because CrUX uses a trailing 28-day reporting window.
- Avoid common optimization mistakes such as installing a separate plugin for every warning, making multiple changes before retesting, testing only the homepage, overlooking CDN caches, comparing inconsistent cache states, or unloading assets without validating every affected template and language.
- Effective WordPress optimization is therefore an iterative process of diagnosis, controlled implementation, validation and monitoring, rather than a one-time attempt to maximize a PageSpeed score.
1. Trace PSI warnings to their root causes
PSI audits the HTML, CSS, JavaScript, media and network responses delivered to the browser. It has no direct knowledge of the WordPress theme, plugin settings, database queries, cache configuration or CDN rules that produced those resources.
For example, a render-blocking request could come from the theme, Elementor, a plugin widget, a consent platform or custom code. High Time to First Byte could originate from hosting capacity, uncached page generation, slow database queries, redirect handling or a CDN cache miss. Installing another optimization plugin before identifying the layer can add complexity without solving the original bottleneck.
The most reliable process follows a consistent chain: Metric => Likely Cause => Responsible Layer => Controlled Change => Validation.
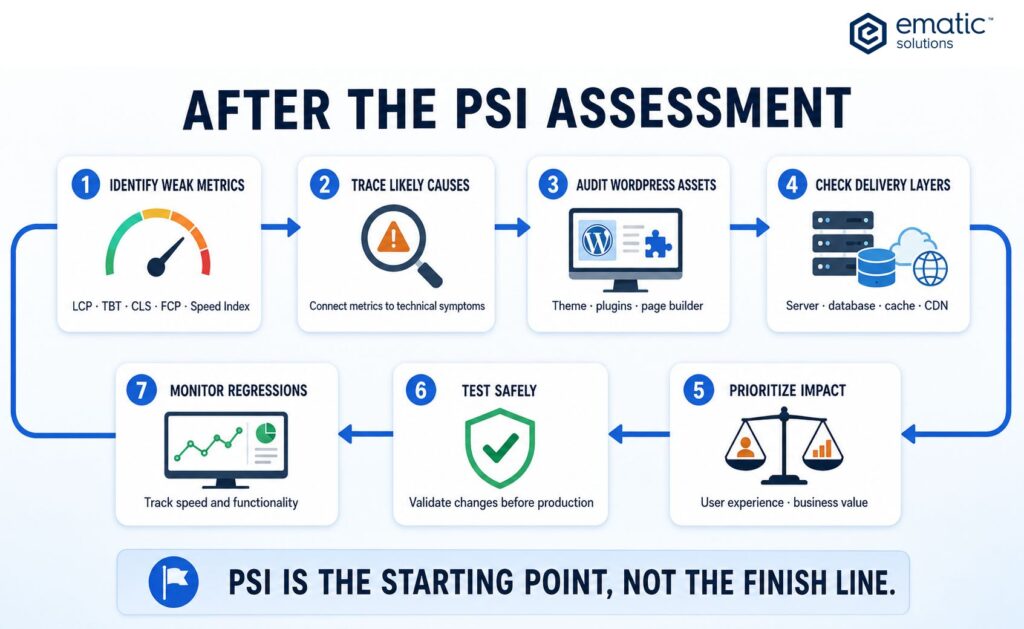
A PSI assessment should lead to root-cause investigation, controlled testing and continued monitoring.
Read more: Google PageSpeed Insights: What's Is That?
2. Prioritize the findings before changing WordPress
Review the report in this order:
- Start with failed real-user Core Web Vitals on business-critical templates.
- Identify lab metrics that remain weak across repeated runs.
- Review Insights and Diagnostics that help explain those metrics.
- Consider how many templates and users are affected.
- Estimate the likely impact, implementation risk and testing requirement.
- Defer low-impact warnings that do not materially affect the target metrics or user journey.
A repeated LCP problem on a high-traffic product template usually deserves more attention than a minor image-saving recommendation on a rarely visited page. Performance work should follow user and business impact rather than the number of red warnings in the report.
3. Connect PSI signals to the responsible technical layer
The relationships are many-to-many: one metric can be affected by several layers, and one layer can influence several metrics. Use the following matrix as a starting hypothesis, not an automatic diagnosis.
| PSI signal | Likely WordPress or delivery layers | First checks |
|---|---|---|
| High TTFB | Hosting, WordPress execution, database, page cache, CDN | Initial document timing, cache status, redirects and server processing |
| Poor FCP / Speed Index | Server response, CSS, fonts, theme and page builder | Render-blocking requests, critical resources and above-the-fold complexity |
| Poor LCP | TTFB, hero media, CSS, fonts and resource priority | LCP element, discovery delay, load time and render delay |
| High TBT | Plugins, page builder, JavaScript and third parties | Long tasks, unused JavaScript, execution time and duplicate libraries |
| Poor INP | Event handlers, DOM complexity and main-thread work | Slow real interactions, post-load tasks and interactive widgets |
| Poor CLS | Media sizing, fonts and dynamic components | Missing dimensions, injected content and unstable containers |
3.1. High TTFB: investigate the delivery chain
Time to First Byte (TTFB) measures how long the browser waits before the initial response begins to arrive. In WordPress, high TTFB can delay every later loading milestone, including FCP and LCP.
What to investigate
- Redirects before the final HTML request
- Origin response time with and without the CDN
- Page-cache headers, cache hits and cache misses
- Logged-out versus logged-in performance
- Slow database queries and uncached API calls
- Expensive plugin or theme processes during page generation
- Hosting CPU, memory, PHP workers and geographic distance
Typical WordPress actions
- Correct full-page caching for public pages and verify that the CDN is caching eligible responses.
- Review slow database queries and repeated remote requests before adding database-cleanup tools.
- Reduce unnecessary redirects and confirm that HTTPS, www and trailing-slash rules resolve consistently.
- Review object caching and hosting capacity when page generation remains slow after page caching is excluded.
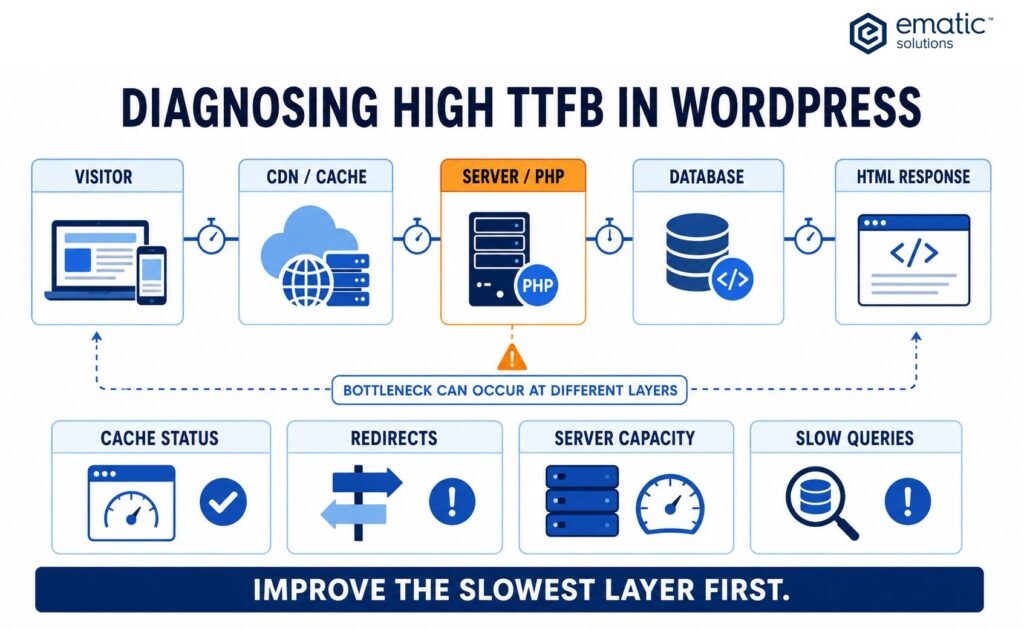
The process for diagnosing high TTFB in WordPress, from CDN/cache and server/PHP to the database. Performance bottlenecks can occur at different layers, so the slowest layer should be identified and optimized first.
3.2. Poor FCP or Speed Index: review the critical rendering path
Poor First Contentful Paint or Speed Index often means that the browser is waiting too long to display meaningful above-the-fold content. The delay may begin with TTFB, but it can also be caused by theme CSS, page-builder styles, custom fonts or scripts that block rendering.
What to investigate
- Render-blocking stylesheets and synchronous scripts
- Large global CSS files loaded on every template
- Page-builder and widget assets that the current page does not use
- Font files, weights and third-party font domains
- An excessive DOM or overly complex above-the-fold layout
Typical WordPress actions
- Disable unused page-builder modules and unload confirmed unused assets by template.
- Load non-critical CSS and JavaScript appropriately after testing dependencies and responsive behaviour.
- Reduce unnecessary font families and weights, use font-display appropriately and preload only critical font files.
- Simplify heavy hero sections and avoid loading sliders, animations or hidden components before they are needed.
3.3. Poor LCP: identify the element and the slow phase
Before optimizing Largest Contentful Paint, identify the actual LCP element. It may be a hero image, product image, heading, background image, banner or text block that depends on a custom font.
Then separate the delay into four phases: TTFB, resource load delay, resource load time and render delay. This prevents the common mistake of compressing an image when the real problem is late discovery, JavaScript rendering or slow HTML delivery.
What to investigate
- Whether the LCP resource is discoverable in the initial HTML
- Whether the LCP image has been lazy-loaded
- Image dimensions, file size, format and responsive srcset
- CSS background images that are discovered late
- Font-loading and CSS delays affecting an LCP heading
- Sliders or JavaScript that replace the initial hero after load
Typical WordPress actions
- Resize and compress the LCP image and serve an appropriate WebP or AVIF version.
- Exclude the true LCP image from lazy loading and give the browser an early, unambiguous request path.
- Prioritize the resource carefully rather than preloading multiple competing images.
- Reduce render-blocking CSS, font and JavaScript work that delays the element after download.
- Improve TTFB when the entire LCP timeline begins with a slow document response.
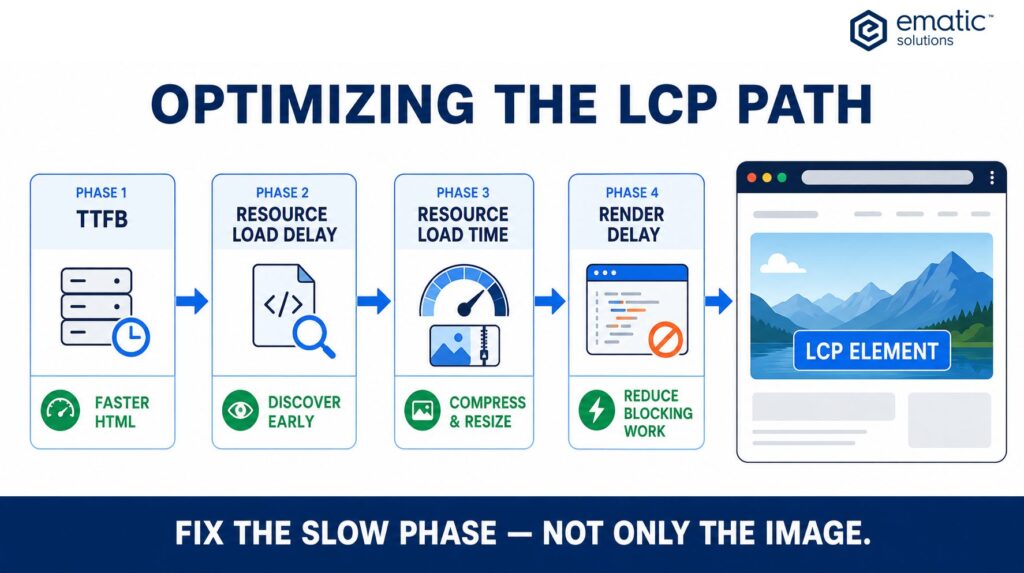
Effective LCP optimization requires identifying and improving the slow phase rather than focusing only on image compression.
3.4. High TBT or poor responsiveness: reduce main-thread work
Total Blocking Time (TBT) is a Lighthouse lab metric that measures blocking work during page load. INP is a field metric that evaluates the latency of real user interactions. They can point toward related JavaScript and main-thread problems, but TBT is not a direct replacement for INP.
What to investigate
- Long tasks in the DevTools Performance panel
- Unused JavaScript in the Coverage panel
- Plugin and page-builder assets loaded globally
- Tag Manager, analytics, advertising and consent scripts
- Sliders, filters, store locators, chat tools and other interactive widgets
- Duplicate libraries or multiple plugins providing similar features
Typical WordPress actions
- Deactivate unused plugin modules before adding another optimization layer.
- Unload confirmed unused assets on the templates where they are not required.
- Defer or delay non-critical scripts only after testing their dependencies, consent rules and event tracking.
- Remove duplicate functionality and simplify widgets that create excessive JavaScript or DOM work.
- Review third-party tags with marketing and analytics owners before changing their loading behaviour.
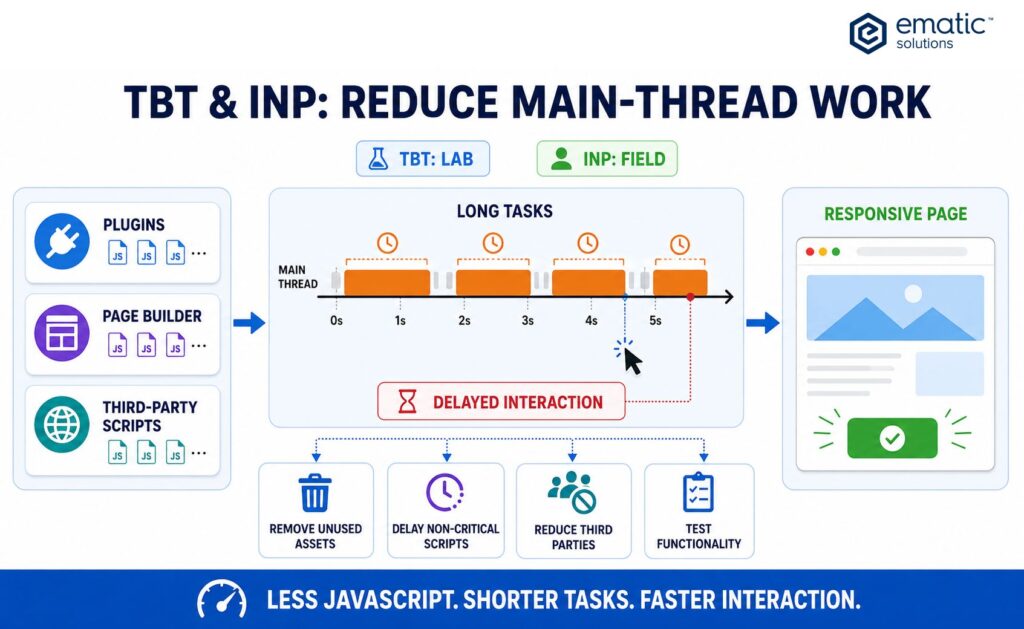
Removing unused JavaScript, delaying non-critical scripts and reducing main-thread work can help improve TBT, INP and overall page responsiveness.
3.5. Poor CLS: reserve space before content arrives
Cumulative Layout Shift (CLS) becomes poor when visible content moves unexpectedly. WordPress sites commonly introduce shifts through media without dimensions, font replacement, cookie banners, sticky headers, sliders and content inserted after the initial render.
What to investigate
- Images, videos and iframes without stable dimensions or aspect ratios
- Late-loading fonts with substantially different fallback metrics
- Cookie notices, promotional banners and pop-ups inserted above content
- Sticky headers that change height after JavaScript initializes
- Dynamic prices, reviews, filters or advertisements without reserved containers
Typical WordPress actions
- Add explicit dimensions or aspect ratios to media and embedded content.
- Reserve stable space for banners, forms, widgets and asynchronous components.
- Use carefully matched fallback fonts and avoid unnecessary late font swaps.
- Keep header and navigation dimensions consistent before and after initialization.
4. Prioritize changes by impact and risk
Group potential changes before implementation:
- High impact, lower risk: correct media dimensions, compress oversized images, remove clearly unused modules and fix obvious cache misconfigurations.
- High impact, medium risk: unload assets by template, change CSS or JavaScript loading, adjust font delivery and revise CDN caching rules.
- High impact, higher risk: replace major plugins, change the theme or page builder, modify application logic or migrate hosting infrastructure.
- Low impact: informational warnings with little measurable influence on the target metrics or user journey.
Dependencies matter. Improving TTFB may improve FCP and LCP without any image change. Removing unnecessary JavaScript may improve both TBT and LCP render delay. Solve upstream bottlenecks before applying several downstream workarounds.
5. Implement and test one change at a time
Optimization is easier to validate and reverse when each change has a clear hypothesis. Use a controlled workflow:
- Record the URL, device profile, median lab metrics and current functionality.
- Select one target metric and one suspected technical layer.
- Apply the change on staging when it carries layout, functional or delivery risk.
- Clear the relevant browser, WordPress, server and CDN cache layers.
- Repeat the same lab test under comparable conditions.
- Compare the individual metrics, not only the overall score.
- Retest forms, menus, responsive layouts, tracking and consent behaviour.
- Keep, adjust or revert the change before moving to the next hypothesis.
Avoid activating several optimizations together. If performance improves but a feature breaks, or if the score falls, simultaneous changes make the responsible configuration difficult to identify.
6. Validate more than the Performance score
A successful optimization should preserve:
- Menus, navigation and responsive layouts
- Forms, validation and confirmation messages
- Filters, sliders, maps, quizzes and other interactive components
- Analytics events, conversion tracking and consent controls
- Logged-in and account functionality
- Multilingual templates and local-language pages
- Visual stability across common viewport sizes
A higher score is not a successful outcome if it disables revenue tracking, prevents a form submission or breaks a mobile menu. Performance and functionality must be validated together.
7. What PageSpeed score should you realistically aim for?
Google PageSpeed Insights classifies Performance scores into three ranges:
- 90–100: Good
- 50–89: Needs Improvement
- 0–49: Poor
While a score above 90 is an excellent target, achieving 100 should not be treated as a requirement for a well-optimized WordPress website. Real-world sites often depend on analytics, consent management, advertising, embedded media, forms and other third-party services that introduce unavoidable performance overhead.
A more practical goal is to move consistently into the Good range where feasible, while prioritizing improvements to Core Web Vitals and the metrics that reflect actual user experience. For complex WordPress sites, a stable score in the upper end of the Needs Improvement range can still represent meaningful progress if key bottlenecks have been addressed and further optimization would require compromising essential functionality.
Consistency also matters. A website that repeatedly scores around 85–90 while maintaining reliable functionality may be in a healthier position than one that occasionally reaches 95 but fluctuates significantly between tests.
The target should therefore be measurable improvement and a fast, stable user experience—not a perfect score at any cost. Once the major performance bottlenecks have been resolved, further optimization should be evaluated against its implementation effort, maintenance risk and potential impact on business-critical functionality.
8. Monitor after production deployment
Verify the production response after deployment because staging and production may use different cache, CDN, security and third-party configurations. Warm relevant caches, repeat representative lab tests and monitor important templates for layout or functional regressions.
Lab improvements can appear immediately. Field-data changes emerge more slowly because PSI reports a trailing 28-day CrUX window. Continue monitoring after plugin updates, theme releases, campaign launches and new third-party tags, as each can introduce new assets or main-thread work.
9. Common optimization mistakes
- Installing a different plugin for every PSI warning
- Making several configuration changes before retesting
- Optimizing only the homepage
- Clearing the WordPress cache but overlooking the CDN or reverse proxy
- Comparing a cold-cache result with a warm-cache result
- Unloading assets without checking every affected template and language
- Chasing a score of 100 instead of improving user-facing metrics
- Ignoring forms, tracking, consent tools and responsive behaviour afterward
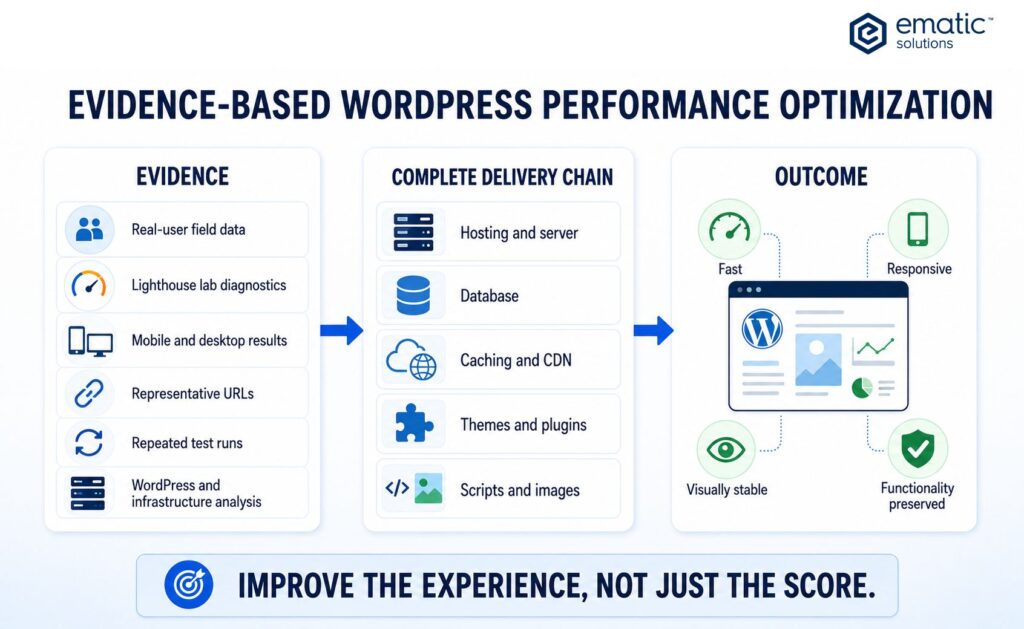
Evidence-based optimization connects PSI findings to the complete WordPress delivery chain.
PageSpeed Insights should be treated as the beginning of the optimization process, not as an automatic list of fixes. Effective WordPress optimization connects each weak metric to its likely causes, confirms the responsible technical layer and validates one controlled change at a time.
A complete review considers hosting, WordPress execution, databases, caching, CDN delivery, themes, page builders, plugins, media, fonts and third-party scripts. The goal is not simply to increase a score, but to provide a consistently faster and more stable experience without compromising the website’s functionality, analytics or business requirements.
This article was written and reviewed by the senior development team at Ematic Solutions. They work directly with client websites across a wide range of platforms, from WordPress to custom-built web applications, handling performance engineering, caching architecture, and Core Web Vitals, and translating raw PageSpeed Insights data into safe, production-ready optimization plans.
References
- Pollard, B., & Wagner, J. (2025, November 18). Time to First Byte (TTFB). web.dev. Retrieved September 3, 2026, from https://web.dev/articles/ttfb
- Walton, P., & Pollard, B. (2025, March 31). Optimize Largest Contentful Paint. web.dev. Retrieved September 3, 2026, from https://web.dev/articles/optimize-lcp
- Google. (2019, October 9). Total Blocking Time. Chrome for Developers. Retrieved September 3, 2026, from https://developer.chrome.com/docs/lighthouse/performance/lighthouse-total-blocking-time
- Osmani, A., & Pollard, B. (2025, February 7). Optimize Cumulative Layout Shift. web.dev. Retrieved September 3, 2026, from https://web.dev/articles/optimize-cls