
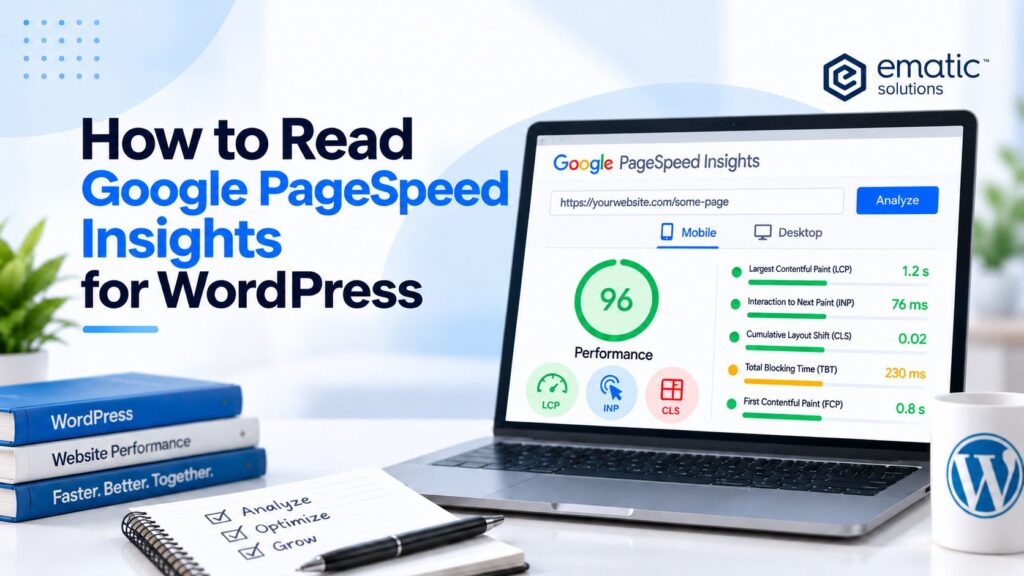
A Google PageSpeed Insights report for your WordPress website contains far more than a single Performance score, it combines real-user field data with a controlled Lighthouse lab test, and reading it correctly is the first step before touching any theme, plugin or hosting setting. In this Ematic Solutions guide, we break down what each part of the report means and how to build a reliable testing baseline.
This section summarizes the key points covered in this article.
- A PageSpeed Insights (PSI) report combines two distinct datasets: field data (real Chrome users, trailing 28-day window) and lab data (a single simulated Lighthouse run), and neither replaces the other.
- The Core Web Vitals assessment (LCP, INP, CLS) is based on field data and must show “Good” on all three metrics to pass.
- Field data may appear as “This URL” (page-specific) or fall back to “Origin” (site-wide average), which can hide a slow individual template.
- The Lighthouse Performance score (0–100) is a weighted calculation, made up of TBT (30%), LCP (25%), CLS (25%), FCP (10%), and Speed Index (10%), not a simple pass/fail count.
- Field and lab results can differ because they measure different users, time periods, and test conditions, which is normal, not an error.
- To test a WordPress site correctly, check multiple templates (not just the homepage), test Mobile and Desktop separately, repeat the lab test 3–5 times and use the median, and test on production.
- A score of 100 isn’t the goal, since 90+ is already Good, but passing the real-user Core Web Vitals assessment matters more for SEO and UX than chasing a perfect Lighthouse score.
- PSI identifies symptoms, not the responsible WordPress plugin, theme, or server layer, and that diagnosis is the next step.
1. What does Google PageSpeed Insights measure?
Google PageSpeed Insights evaluates an individual webpage on mobile and desktop. After a complete URL is submitted, the report can provide:
- A Core Web Vitals assessment based on eligible real-user data
- Field metrics from the Chrome User Experience Report, when available
- A Lighthouse Performance score from 0 to 100
- Individual loading, responsiveness and visual-stability metrics
- Performance Insights and Diagnostics
- Separate Accessibility, Best Practices and SEO audits
One limitation is especially important: PSI analyzes the submitted URL, not every page on the website. A homepage, product page, store locator, article and contact form can use different templates, plugins and scripts and therefore produce different results.
PSI also evaluates the page output rather than the WordPress configuration behind it. It can reveal symptoms such as a slow server response or excessive JavaScript, but it cannot automatically determine whether the cause is a plugin, database query, cache layer, CDN rule or third-party service.
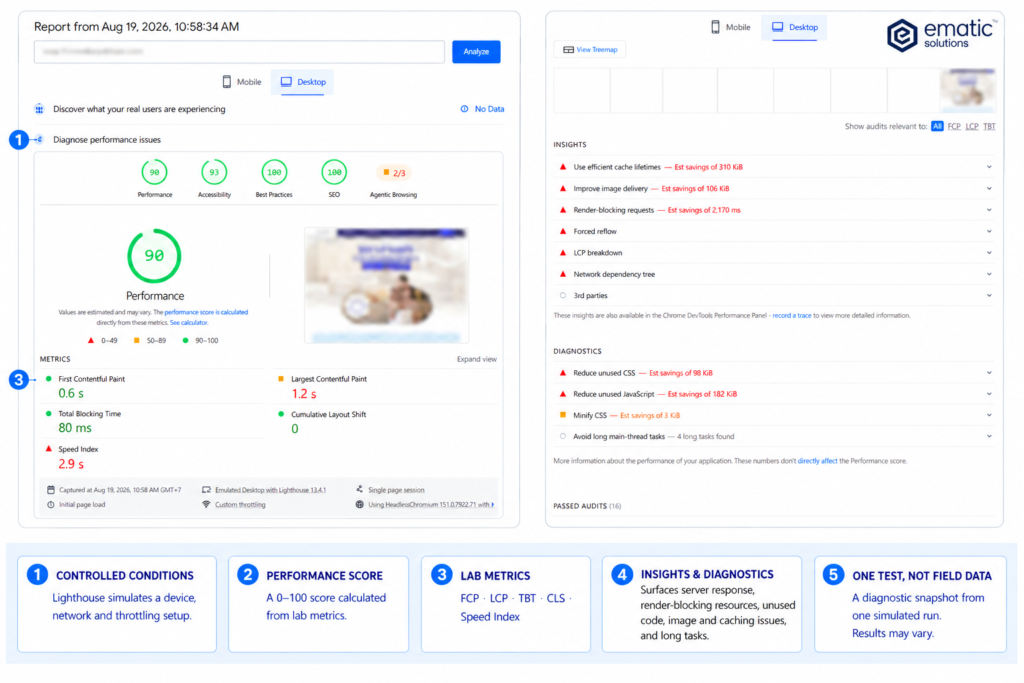
The PSI report separates real-user experience data from Lighthouse lab diagnostics.
Read more: Google PageSpeed Insights: What’s Is That?
Read more: How to Optimize WordPress Based on Google PageSpeed Insights
2. Understanding the two parts of a PSI report
PageSpeed Insights combines field data from real users with lab data from a simulated test. Neither dataset replaces the other because each answers a different question.
| Field data | Lab data |
|---|---|
| What did eligible real visitors experience? | What happened during this simulated test? |
| Uses Chrome User Experience Report data | Uses a Lighthouse test run |
| Represents a trailing 28-day window | Represents one point-in-time run |
| Includes varied devices, networks and cache states | Uses controlled device and network conditions |
| Useful for monitoring real-user outcomes | Useful for diagnosing technical bottlenecks |
| May be available at URL or Origin level | Tests only the submitted URL |
2.1. Field data: what real users experienced
Field data is supplied by the Chrome User Experience Report (CrUX). PSI updates this dataset daily using a trailing 28-day collection period. It is historical rather than real-time, so an optimization deployed today may take time to become fully visible in the report.
The field section reports the current Core Web Vitals:
- Largest Contentful Paint (LCP): loading performance
- Interaction to Next Paint (INP): responsiveness
- Cumulative Layout Shift (CLS): visual stability
It also reports supporting metrics such as First Contentful Paint (FCP) and Time to First Byte (TTFB). The Core Web Vitals assessment uses the 75th percentile of eligible experiences. In general, all applicable Core Web Vitals must be within the Good range for the assessment to pass.
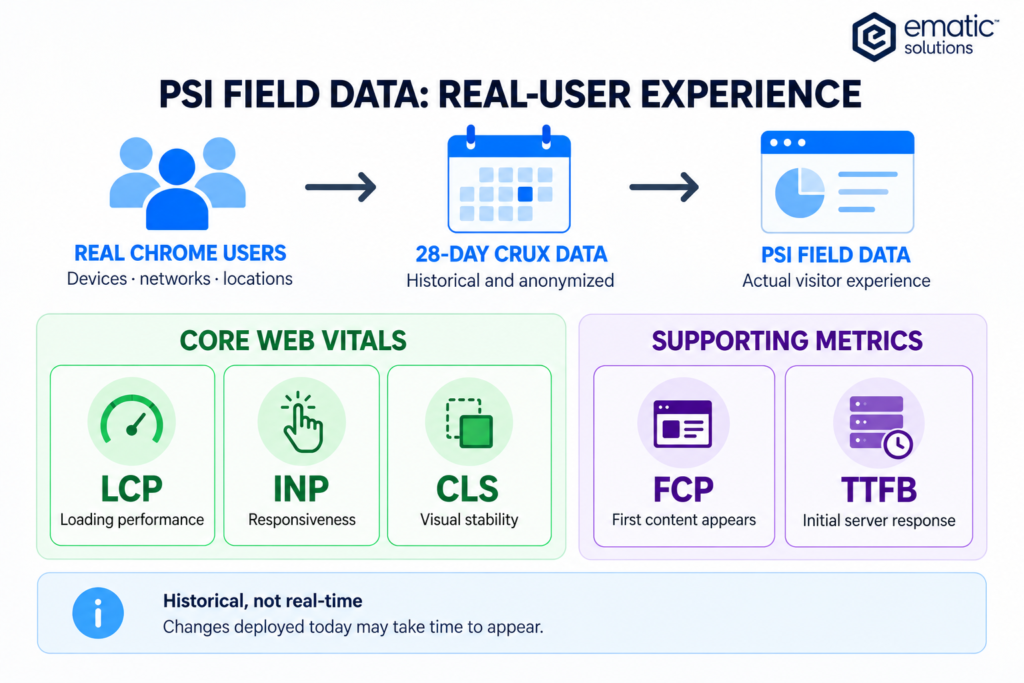
PSI field data summarizes eligible Chrome user experiences over a trailing 28-day window.
2.2. What do ‘This URL’ and ‘Origin’ mean?
PSI requires enough eligible real-user samples before it can report page-level data. When sufficient data exists, the report can display This URL, representing experiences associated with the specific page being evaluated.
If page-level data is unavailable, PSI may fall back to Origin data. This aggregates eligible experiences across pages on the same origin. Origin results can show a general website trend, but they may not represent the submitted template accurately. A fast homepage, for example, can mask a slow product template in Origin-level data.
If neither the URL nor the Origin has enough eligible data, the field-data section will show no assessment. This does not mean the page is fast or problem-free; it only means CrUX cannot provide a representative dataset.
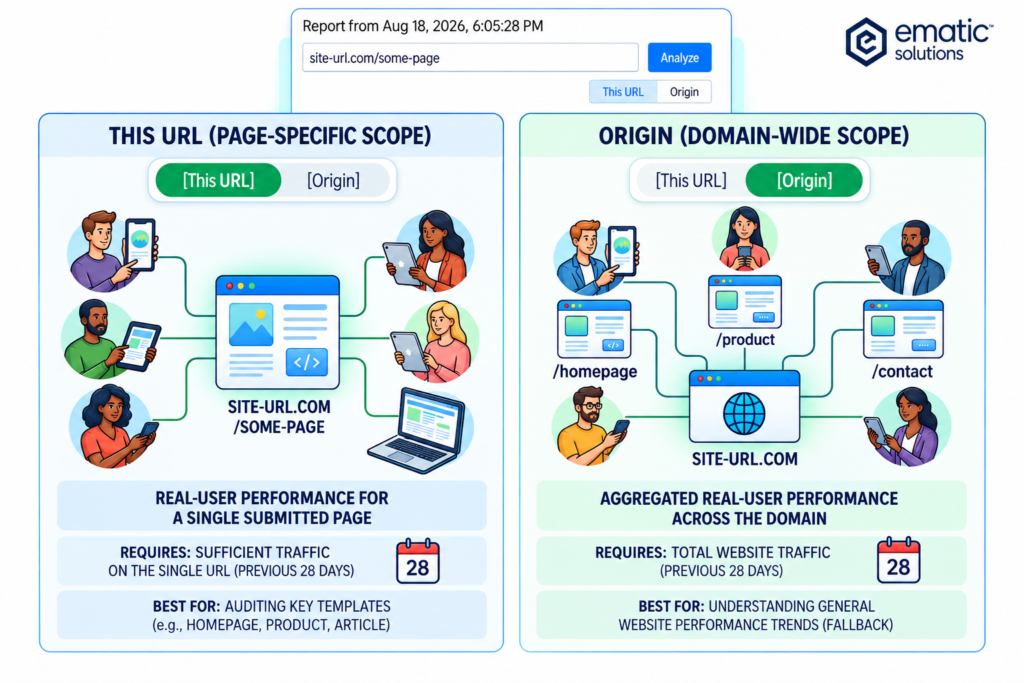
URL-level data describes one page, while Origin data aggregates eligible experiences across the same origin.
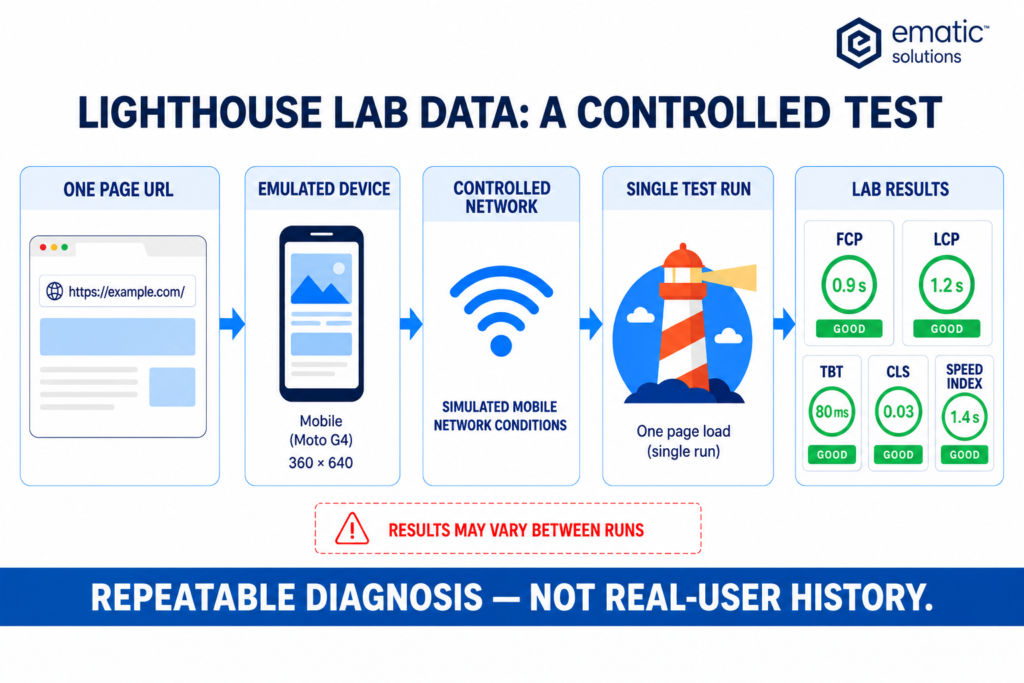
2.3. Lab data: a controlled Lighthouse test
The lab section is generated by Lighthouse. It loads the submitted page under simulated device and network conditions and produces a Performance score with individual metrics, Insights and Diagnostics.
Lab results can expose issues such as:
- Slow initial document response
- Render-blocking CSS or JavaScript
- Large or poorly prioritized images
- Unused code and excessive main-thread work
- Inefficient cache policies
- Layout shifts and unsized media
- Large network payloads and third-party overhead
Since Lighthouse represents one controlled run, it is most useful for repeatable diagnosis and development testing. A single run should not be treated as the site’s permanent performance level.
2.4. Why field and lab results may be different
A page can score well in Lighthouse while still failing its real-user Core Web Vitals assessment. The opposite can also occur. The apparent contradiction usually reflects different users, time periods and test conditions rather than an error in PSI.
Real visitors may use older devices, unstable networks and different cache states. They may interact with menus, cookie banners, filters, forms and pop-ups that a basic page-load test does not reproduce. Field data also includes variations accumulated over 28 days, while one Lighthouse run captures only its immediate environment.
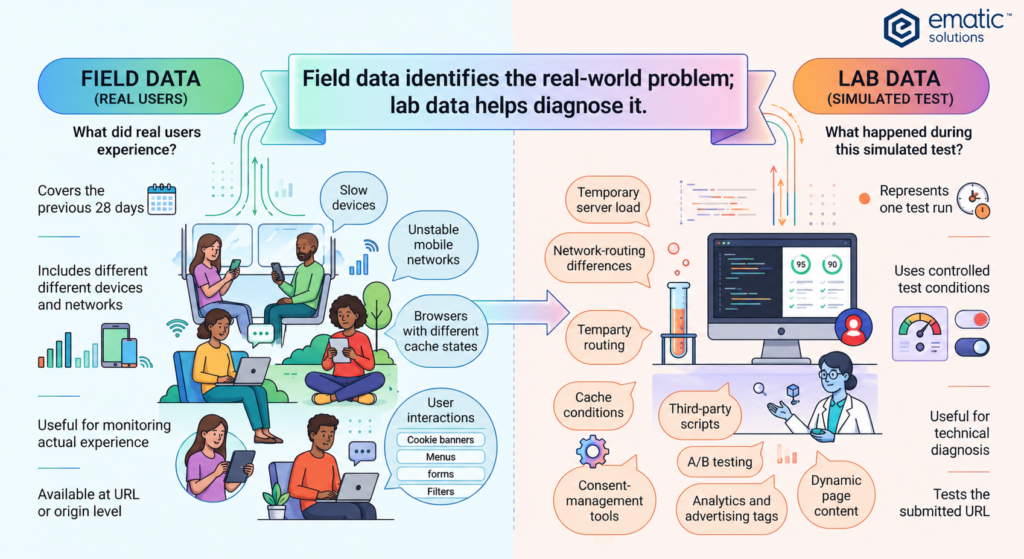
Lab results can also fluctuate because of:
- Temporary server load or cache state
- Network-routing and test-location differences
- A/B tests and changing third-party content
- Analytics, advertising and consent-management scripts
- Background resource contention in the test environment
For this reason, field data should be used to understand real-user trends, while lab data should be used to investigate the technical conditions that may be producing those trends.
3. How to interpret the Lighthouse Performance score
The Lighthouse Performance score uses three ranges: 90-100 is Good, 50-89 Needs Improvement and 0-49 is Poor. The score is a weighted calculation rather than a simple count of passed and failed audits.
| Lighthouse metric | Current score weight |
|---|---|
| Total Blocking Time (TBT) | 30% |
| Largest Contentful Paint (LCP) | 25% |
| Cumulative Layout Shift (CLS) | 25% |
| First Contentful Paint (FCP) | 10% |
| Speed Index | 10% |
Only the scored metrics contribute directly to the Performance score. The Lighthouse scoring guidance explains that Insights and Diagnostics affect the score only indirectly when they improve one or more metrics. Lighthouse 13 consolidated many older Opportunity audits into the current Insights format without changing the performance-scoring model.
A score of 100 should not be treated as the only acceptable result. Near-perfect scores require progressively larger metric improvements, and a website must still preserve its design, functionality, analytics and business requirements.
4. How to test a WordPress website correctly
A meaningful assessment should include representative page templates instead of only the homepage. Depending on the website, the sample may include:
- Homepage
- Category, collection or archive page
- Product or service listing
- Individual product or service page
- Blog article
- Contact, registration or lead-generation page
- Dynamic templates such as a store locator, quiz or account area
For each selected URL:
- Open PageSpeed Insights and enter the complete production URL.
- Review Mobile and Desktop as separate test environments.
- Confirm whether the field section represents This URL or Origin.
- Record the Core Web Vitals assessment and individual field metrics.
- Record the Lighthouse score and each scored lab metric.
- Review the Insights and Diagnostics connected to the weakest metrics.
- Repeat the Lighthouse lab test three to five times.
- Use the median run as the baseline instead of selecting only the best score.
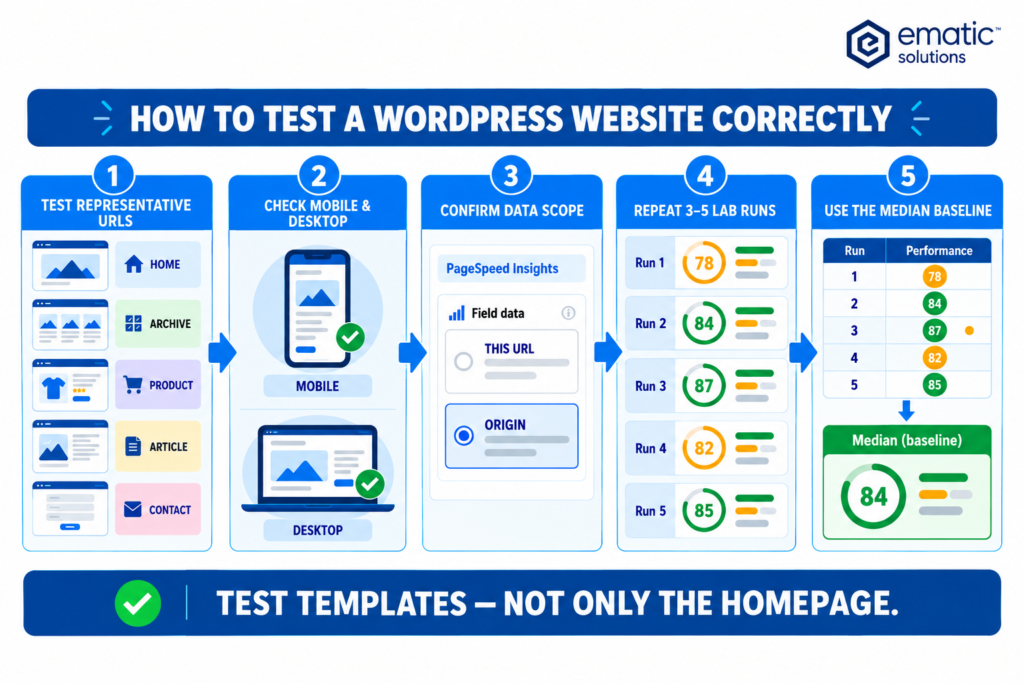
Testing normally begins with Mobile because it represents a more restrictive device and network profile. Desktop should still be assessed independently because responsive layouts may load different media, components and scripts.
Production is the appropriate environment for the real-user baseline. A publicly accessible staging URL can support pre-deployment lab diagnosis, but it normally has no CrUX data and may behave differently because of authentication, cache rules, no-index settings or restricted CDN delivery.
5. Common mistakes when reading PSI results
Google PageSpeed Insights is an effective starting point for evaluating WordPress performance, but the overall score is only one part of the assessment. A reliable interpretation combines real-user field data, Lighthouse lab metrics, Mobile and Desktop testing, representative URLs and repeated runs.
| Common mistake | Better interpretation |
|---|---|
| Trusting one test run | Repeat the lab test and use a median baseline. |
| Testing only the homepage | Test representative templates and business-critical journeys. |
| Looking only at the score | Review the scored metrics and the diagnostics connected to them. |
| Ignoring URL versus Origin | Confirm which field dataset the report is displaying. |
| Comparing Mobile directly with Desktop | Evaluate each result under its own test conditions. |
| Treating every warning equally | Prioritize findings that explain the weakest user-facing metrics. |
Most importantly, PSI identifies symptoms and potential opportunities. It does not automatically identify the responsible WordPress plugin, server process or delivery layer. Once the weakest metrics have been identified, the next challenge is determining which WordPress layer is responsible.
Check out our articles to learn how to connect PSI findings to hosting, caching, themes, plugins, images, fonts and third-party scripts without compromising essential website functionality.
6. Frequently asked questions about reading pagespeed insights for wordpress
6.1. What is a good Google PageSpeed Insights score for WordPress?
A good Google PageSpeed Insights score for WordPress is 90 or above, which places your site in the green zone. That said, passing the Core Web Vitals assessment (Field Data) matters more for SEO and user experience than achieving a perfect 100/100 Performance score.
6.2. What is the difference between Lab Data and Field Data in Google PageSpeed Insights?
Lab Data is a performance score calculated in a controlled environment using predefined device and network settings. Field Data, sourced from the Chrome User Experience Report, reflects the actual real-world loading speeds experienced by your website’s visitors over the previous 28 days.
6.3. Why does my PageSpeed Insights score change every time I run a test?
Your score can change due to network congestion, server response fluctuations (TTFB), and general testing variability. Since WordPress dynamically generates pages using PHP and database queries, small delays in hosting performance or third-party script loading will cause your score to fluctuate between tests.
Reading a Google PageSpeed Insights report correctly means looking beyond the single Performance score, combining real-user Field Data, Lighthouse Lab Data, Mobile and Desktop results, and multiple representative page templates rather than the homepage alone, since this is especially important for WordPress websites where themes, plugins, and hosting configurations can produce very different results across templates. Once you can confidently separate what PSI is measuring from what it is not, the next step is connecting each weak metric to its likely cause, whether that is hosting, caching, media, or third-party scripts, and our companion guide on optimizing WordPress based on PageSpeed Insights walks through that process in detail.
This article was written and reviewed by the senior development team at Ematic Solutions. They work directly with client websites across a wide range of platforms, from WordPress to custom-built web applications, handling performance engineering, caching architecture, and Core Web Vitals, and translating raw PageSpeed Insights data into safe, production-ready optimization plans.
References
- Google. (n.d.-a). PageSpeed Insights. Retrieved September 3, 2026, from https://pagespeed.web.dev/
- Google. (n.d.-b). Chrome UX Report (CrUX). Chrome for Developers. Retrieved September 3, 2026, from https://developer.chrome.com/docs/crux/about
- Google. (n.d.-c). Web Vitals. web.dev. Retrieved September 3, 2026, from https://web.dev/articles/vitals
- Google. (n.d.-d). Lighthouse performance scoring. Chrome for Developers. Retrieved September 3, 2026, from https://developer.chrome.com/docs/lighthouse/performance/performance-scoring
- Google. (n.d.-e). Lighthouse overview. Chrome for Developers. Retrieved September 3, 2026, from https://developer.chrome.com/docs/lighthouse/overview